In this text we cover only a fraction of the work done by us. However, transparency is crucial to us, so our ai model is open source. The prediction engine and all of the software used for these plots can be found here.
How does our system work?
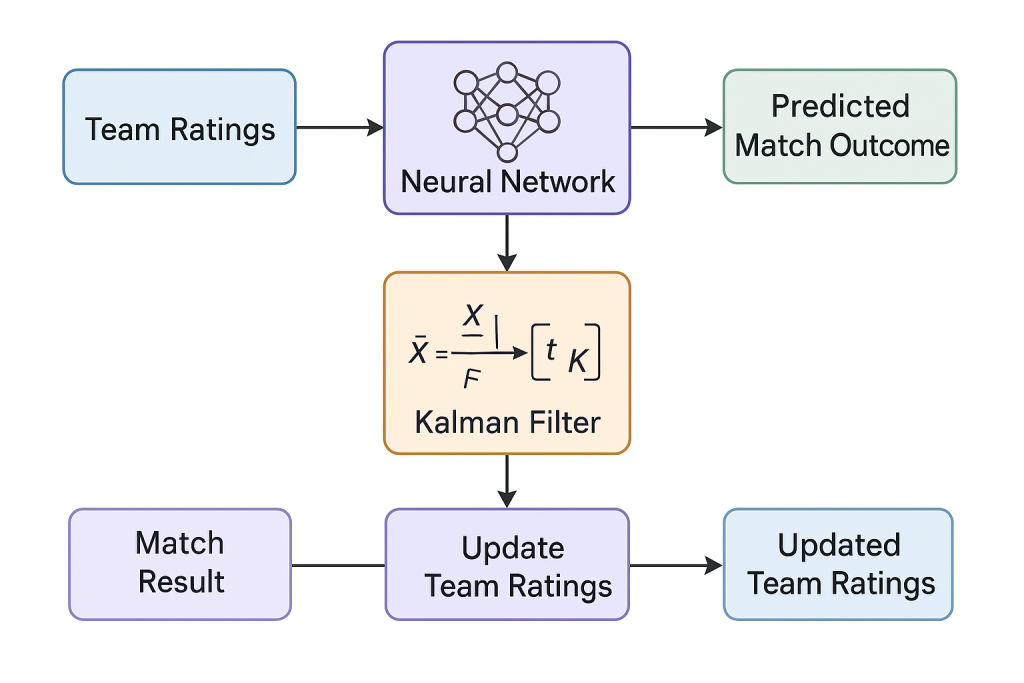
Unique to our site is or hybrid prediction model, which combines classical prediction techniques (Kalman filtering) , with modern neural networks. We first use a neural network to predict different statistics (shots, shots on target, faults,goals etc) of the game. The prediction is based on numbers that quantify the strength of each team (team rattings). Then based on on the diferent between the prediction and the actual result the team’s strenght is updated. The updated team’s strenght will be used to predict the result of the next matches.
The update of the team’s strenght is done using thek Kalman equations. These equations provide an optimal update by combining the network’s predictions with observed match statistics, taking into account the uncertainty in both. This allows the ratings to adjust intelligently and ensures that each update reflects the most likely true team strengths.
Or system has two main advantages compared to typical recursive protocols in machine learning:
- First, the update requires no additional free parameters, reducing training complexity and improving predictive power,
- Secondly it naturally incorporates uncertanty in the prediction. Our model gives the error on the ratings for each team. Which can be used to model the error on the prediction.
Our system is conceptually similar to the Elo rating system, in that it assigns a dynamic rating to each team based on match results and updates those ratings as new games are played. Unlike Elo, we use a neural network to predict match outcomes and the Kalman equations to update team ratings. The Kalman equations provide an optimal update by combining the network’s predictions with observed match statistics, taking into account the uncertainty in both. This allows the ratings to adjust intelligently and ensures that each update reflects the most likely true team strengths.
Our update process follows the diagram below.
More information:
- Top bets a.i open source predictive engine:
- Kalman filter: https://kalmanfilter.net/book.html
- Kalman filter: https://en.wikipedia.org/wiki/Kalman_filter
- Elo raiting model: https://en.wikipedia.org/wiki/Elo_rating_system
How accurate are your predictions?
The table below shows the model’s prediction accuracy across four major European football competitions. As shown, accuracy varies from league to league. This is expected, as some matches are inherently easier to predict than others.
For example, a match between a strong team and a weaker team is often more predictable and therefore yields higher accuracy. In contrast, matches between evenly matched teams are much harder to forecast. As a result, overall accuracy depends heavily on the specific subset of games being evaluated.
| League | Accuracy Model | Accuracy Bookmaker |
|---|---|---|
| English Premier League | 54 % | 58 % |
| English Championship | 47 % | 47 % |
| English League Two | 45 % | 45 % |
| English League One | 51 % | 51 % |
Rather than relying solely on absolute accuracy, we compare our model’s predictions against the implied predictions from betting odds offered by one of Europe’s largest bookmakers. This provides a meaningful benchmark, as bookmaker odds incorporate vast amounts of information and expert analysis.
| League | Accuracy Model | Accuracy Bookmaker |
|---|---|---|
| English Premier League | 54 % | 58 % |
| English Championship | 47 % | 47 % |
| English League Two | 45 % | 45 % |
| English League One | 51 % | 51 % |
Across most leagues, the model performs at a level comparable to bookmaker predictions. While performance is slightly lower in top-tier leagues, the results indicate that the model can serve as a useful tool for informing betting decisions and supporting match analysis.
How good are your probabilities?
In betting, probabilities matter more than simple accuracy. For example, a model might predict that Real Madrid will win, and the betting odds are 1.15. Is this a good bet or not? On its own, this is not enough information. If the opponent’s odds are high enough, it may be worth considering the chance that the model is wrong and bet on the unlikely outcome.
Any model has limited accuracy, so errors are unavoidable. Instead of giving an absolute prediction, our model accounts for this uncertainty by providing probabilistic predictions. For instance, it might say that Real Madrid will win with a 70 percent probability. We can then multiply the betting odds by this probability, such as 1.15 times 0.70, which equals 0.92. If this value is greater than 1, the bet has positive expected value and should be chosen. Using the same logic, we might prefer an unlikely outcome if the betting odds are sufficiently high. In this case, choosing the alternative would be the correct decision, since 4 times 0.30 is greater than 1.
Above we provide a protocol of finding winind bets. Multiply the odds by the probability and if its larger than 1 bet, otherwise not. However this logic relais on the probabilities beeing good enough. But how do we quantify this. This is were the calibration curve comes into play. The idea is as follows:
The model predicts the probability of different outcomes in a game. Before each match, it may say there is a 10% chance of a home win, a 50% chance, or sometimes an 80% chance. In a single game, an 80% prediction can still lose — that is expected. What matters is whether the probabilities are reliable over time, not whether each individual prediction is correct.
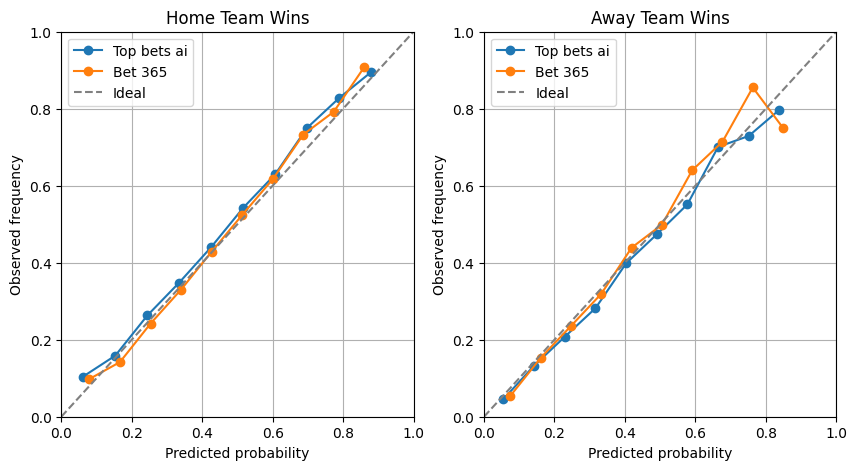
To evaluate this, we group together games with similar predicted probabilities and check what actually happened. If games predicted at 50% result in that outcome about half the time, and games predicted at 80% result in that outcome about 80% of the time, then the model’s probabilities can be trusted. The calibration curve shows this clearly: the x-axis is the probability predicted by the AI, and the y-axis is how often that outcome actually occurred. The dashed “ideal” line represents a perfectly calibrated model — when it predicts 70%, the outcome happens 70% of the time.
The calibration curve shows that our AI model’s probabilities generally approach the ideal predictions. Overall, the betting odds are better calibrated. However, for high-probability away win predictions , it seems to handle calibration more accurately than the odds.
Can our model be used to make money?
Before begging this section lets be clear: No strategy can guarantee consistent winnings, so exercise caution and never bet more than you can afford to lose.
To test our model, I backtested a simple betting strategy. For games that are favorable, I will bet 1 euro/dollar. Favorable games are defined based on the insights described above. To summarize, a game is considered favorable if it meets the following criteria:
- Sufficient Predicted Profit: The model’s predicted profit must be greater than 20%.
- Not from Top European Leagues: Since the model performs worse in top European leagues (see accuracy section), we exclude matches from leagues such as the English Premier League, La Liga, Bundesliga, Serie A, Ligue 1, and the Scottish Premiership.
- Well-Calibrated Bets: Bets are placed only where the model is better calibrated:
- High-confidence away team wins are accepted.
- Low-confidence home team wins are accepted.
- Draws are not filtered.
The betting balance is tracked in the usual way:
- If a bet wins, the balance increases by odds minus the stake.
- If a bet loses, the balance decreases by the stake.
The results are given below:
Using this strategy, our backtesting shows a 100× profit over a course of 2.5 years.
Before you go and spend your savings on this model, please note: this is based on backtesting only. While I have tried to minimize prior knowledge bias, some bias is always present. Forward testing is required to validate real-world performance (we are currently working on this). Many parameters are flexible, and results in live betting may vary. No strategy can guarantee consistent winnings, so exercise caution and never bet more than you can afford to lose.
Ethics & Responsible Betting
Our system is designed to provide insights and analysis of football matches, not to guarantee profits. Betting involves financial risk, and even the most sophisticated predictive models cannot eliminate uncertainty.
We encourage all users to practice responsible betting:
- Never bet more than you can afford to lose. Treat betting as entertainment, not a source of income.
- Use predictions as guidance, not certainty. Probabilities indicate likelihood, not guarantees.
- Start small and evaluate. Test strategies with minimal stakes before committing more funds.
- Stay informed. Consider external factors like injuries, team news, or weather, which the model does not account for.
By clearly acknowledging the limitations and risks, we aim to provide a transparent and ethical approach to using predictive models in sports analysis.
Data Sources / Scope:
Our data is sourced from https://www.football-data.co.uk/
ChatGPT has been used to polish this text correcting grammar and improving readability.